Microservices architectures are the trend, and it’s not surprising since it brings a lot of advantages, especially when shifting to cloud-native applications.
The architecture might get a little more complex, but it’s worth the trade-off in most cases.
One of the challenges with this architecture pattern is that a user request goes through a chain of requests, distributed across the microservices, making it difficult to analyze an error.
We can fix this with a pattern named “Distributed tracing”.
Distributed tracing
This pattern involves using 2 headers: Trace Id and Span Id.
Trace Id
Remains the same throughout the request chain, the first microservice to receive the request, will add the trace-id header when calling the next one(s), where it will be re-used throughout the whole chain.
Essentially, if one microservice receives a request with the header, it is re-used, otherwise, an ID is generated.
This is the magic header that allows you to find the whole request chain.
Span Id
Identifies a “unit of work”, which allows us to group different logs/actions that belong to a “span”.
Imagine you are authenticating a user, the service may first query the cache, looking for a possible token, then if it doesn’t have one, query the authentication server.
That could belong in a span, showing in the logs as part of a sequence.
If missing, it means it’s the first call, so this header gets the same value as the generated Trace Id, to know which log is the first.
Some use a Parent Span Id as well, to make sure the logs are ordered, although when sorting by timestamp this shouldn’t be a problem.
Diagram Example
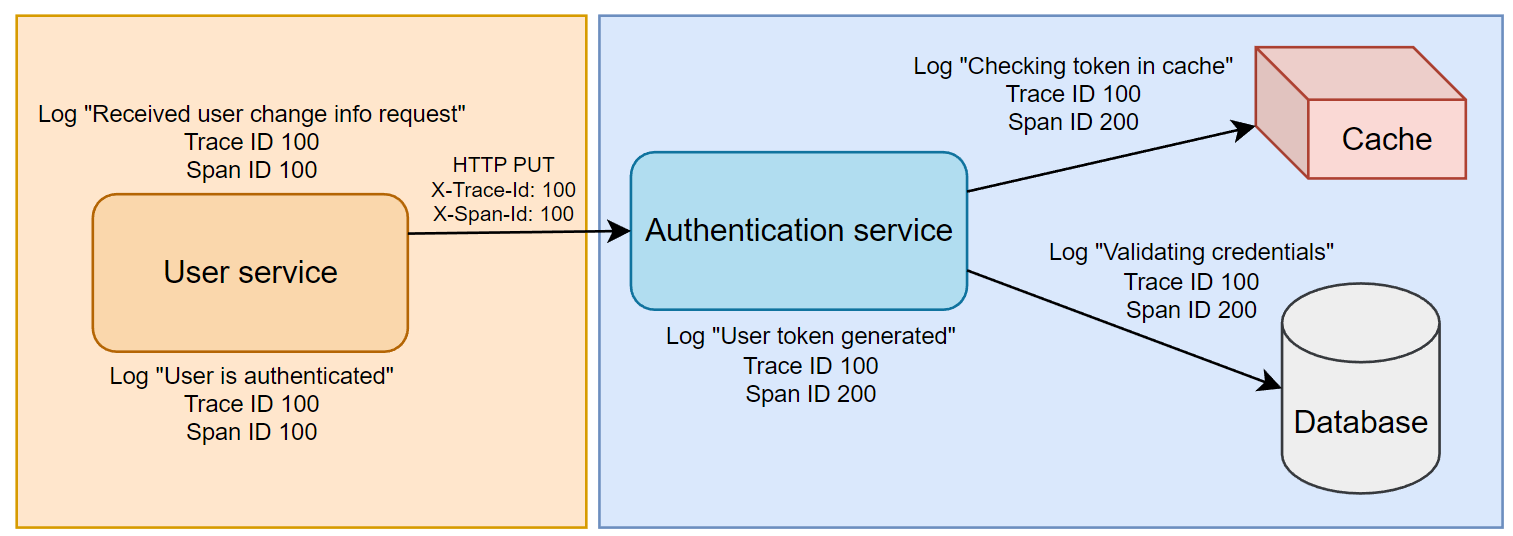
Here you see the 2 spans and 1 trace since those logs on the authentication service side relate to the same domain.
This would produce a log graph similar to:

Also, note that I’ve used simple numeric IDs just to be easier to understand, UUIDs are more commonly used.
Libraries
In a team I worked with, we were adding the trace id header on our own with a logger filter and inserting it in MDC.
Then in Azure Application Insights, the logs can be filtered by a trace-id, and all is good.
The implementation isn’t that complex, but in case you’re looking for a library that handles it, there is Spring Cloud Sleuth, OpenTracing (for Quarkus), and OpenTelemetry.
We also added Application Insight’s Java agent to our services, which handles the span ID part, giving us the request chain with nearly everything that happened throughout the request, including database and cache queries.
We have an article explaining how we do that.
